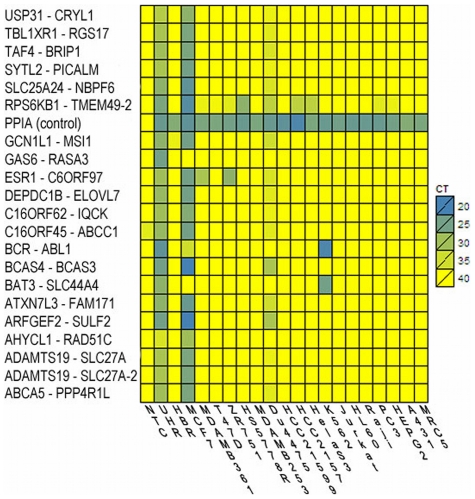
Figure 6. Screening of fusion assays in cancer cell lines reveal recurring fusions.
Heat map of the expression of selected gene fusions (rows) in 20 samples including 18 cancer cell lines (columns). Lower cycle threshold (CT) indicates a higher level of expression and is highlighted in blue. High CT (max 40, yellow) indicates no expression. PPIA is used as positive control and non template control sample (NTC) as negative control.

