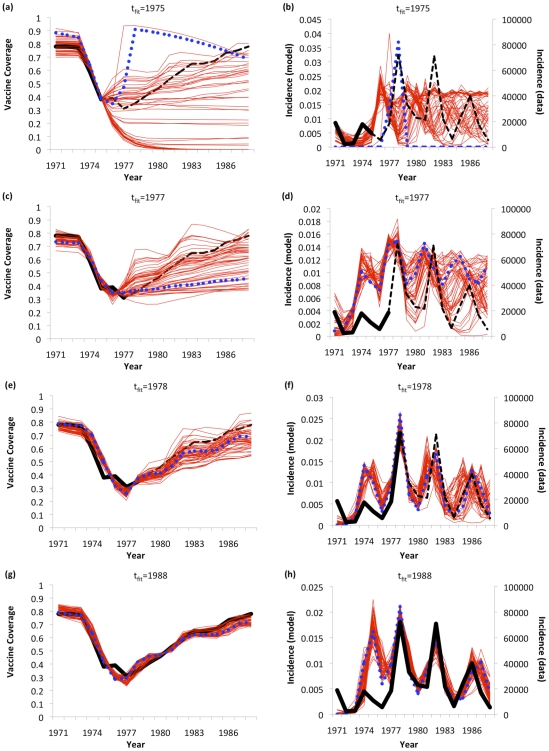
Figure 4. Predictive analysis of behavior-incidence model for the pertussis vaccine scare: predictions up until 1988 were made using data up until t fit = 1975 (a, b); 1977 (c, d), 1978 (e, f) and 1988 (g, h) for both vaccine coverage (a, c, e, g) and case notifications (b, d, f, h).
Best fitting model (blue dots), 50 realizations from PSA (red lines), vaccine coverage and disease incidence data used to fit model (t≤t fit; thick black lines), and data used to evaluate model predictions (t>t fit; dashed black lines) are shown.

