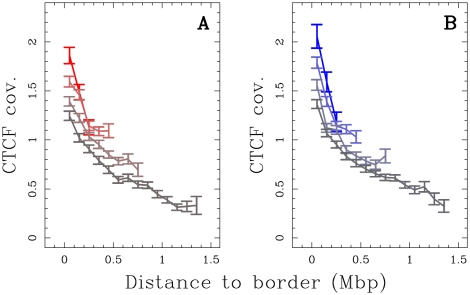
Figure 5. Enrichment in insulator-binding protein CTCF at replication U-domains borders.
(A) Mean coverage by CTCF enriched signals versus the distance to the closest U-domain border in K562 cell line for four U-domain size categories: L 0.8 Mb, 0.8 Mb
 L
L 1.2 Mb, 1.2 Mb
 L
L 1.8 Mb and 1.8 Mb
 L
L 3 Mb, from light to dark red curves (genome-wide mean value = 0.0051). (B) Same as in (A) but for the GM06990 cell line (blue code shades) (genome-wide mean value = 0.0046).

