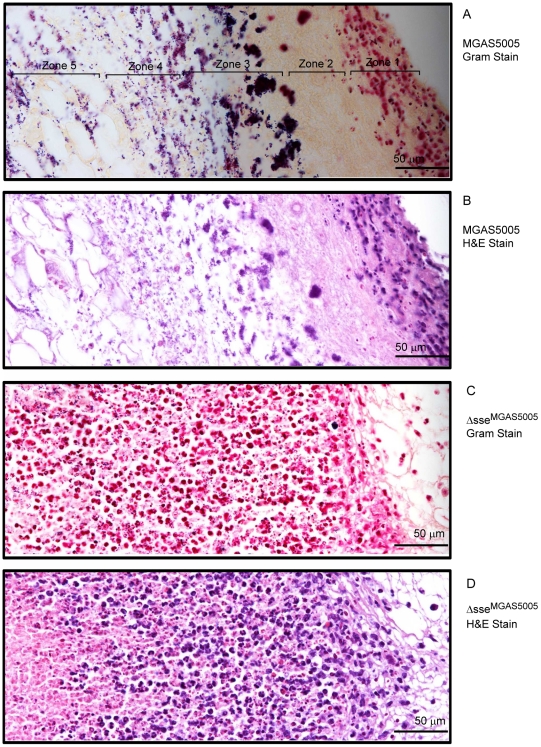
Figure 5. Histological analyses showing the difference in levels and patterns of inflammatory cell infiltration between the MGAS5005 and Δsse MGAS5005 infections.
BALB/c mice were subcutaneously inoculated on the back with 1.0×10⁸ cfu MGAS5005 or 1.1×10⁸ cfu Δsse MGAS5005, and the skin samples were collected at 24 h after inoculation. The microscopic pictures of the Gram and H&E-stained samples were each combined from three snapshots that were taken at a 40× magnification. The five zones in panel A represent different morphologies. Panels: (A), MGAS5005/Gram stain; (B), MGAS5005/H&E Stain; (C), Δsse MGAS5005/Gram stain; and (D), Δsse MGAS5005/H&E stain.

