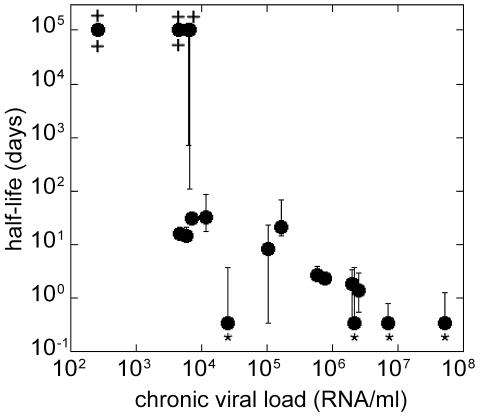
Figure 5. SIV DNA half-life decreases with increasing chronic plasma viral load.
The chronic plasma viral load (estimated as the geometric mean viral load from day 100 post-infection) is significantly correlated with the estimated half-life of SIV DNA for each animal (Spearman correlation, r = −0.8358, p<0.0001). The error bars represent confidence intervals (C. I); “*” marks the C. I. limit <0.5 days and “+” marks the C. I. limit >105 days.

