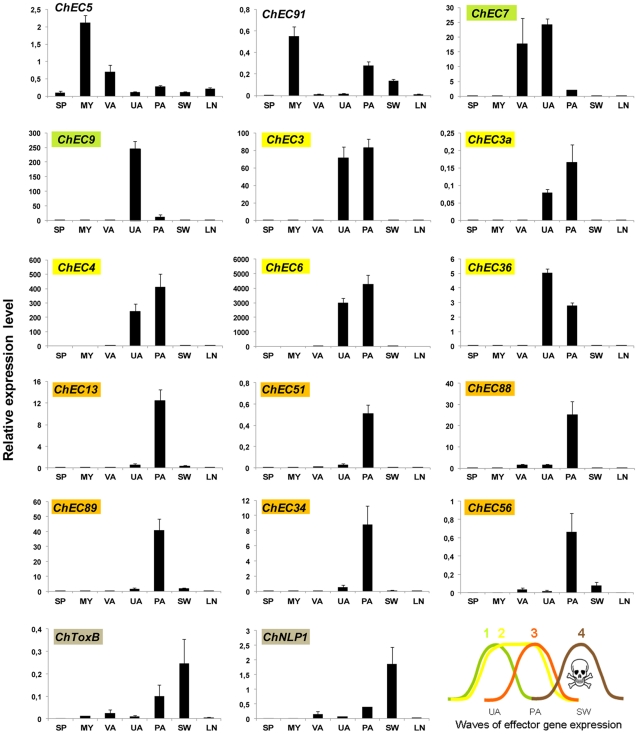
Figure 2. Expression profiling of selected biotrophy-associated ChEC and putative toxin genes by qRT-PCR.
Expression levels are shown relative to the mean expression of actin and α-tubulin. Genes with highest expression in planta are highlighted with colours, indicating distinct waves of effector gene expression. In vitro cell types are: dormant spores (SP), saprotrophic mycelium (MY) and mature appressoria (VA). In planta stages are: unpenetrated appressoria (UA), penetrated appressoria with nascent biotrophic hyphae beneath (PA), biotrophy to necrotrophy switch (SW) and late necrotrophy (LN).

