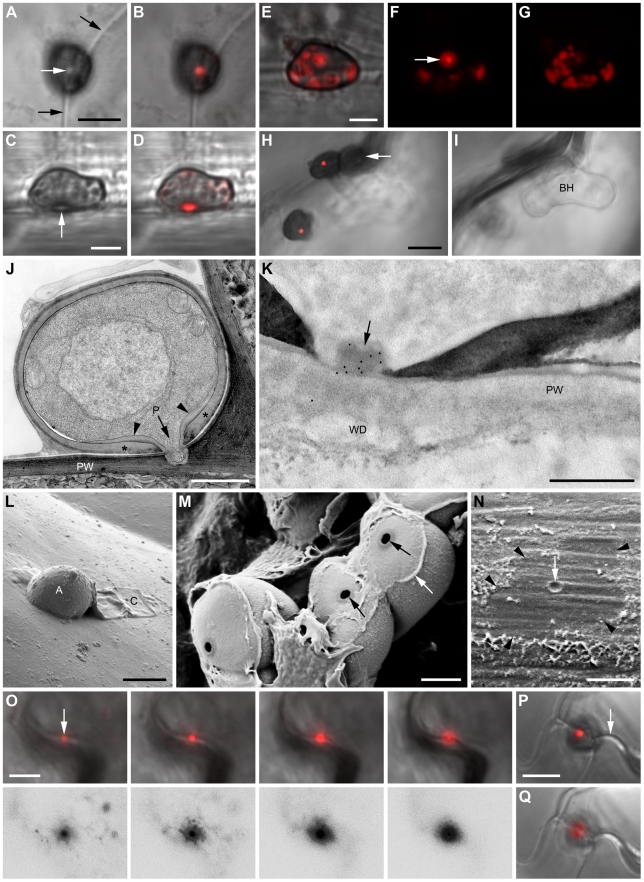
Figure 3. Appressorial pores as an interface for focal ChEC delivery.
Transformant appressoria expressing the wave 2 effectors ChEC36:mRFP (A–O) and ChEC6:mRFP (P, Q). Appressoria or penetration sites after removal of appressoria were examined by confocal laser scanning microscopy viewed from above (A, B, E–I, O–Q) or from the side (C, D), and with transmission electron microscopy (J, K) and scanning electron microscopy (L–N). (A–D) Bright field and maximum fluorescence intensity overlay images of appressoria. Black arrows indicate the anticlinal plant cell wall and white arrows the penetration pore. (E) Fluorescence overlay image of an appressorium showing weak peripheral labelling of intracellular structures. (F, G) Fluorescence recorded with identical settings at the base (F) and the center (G) of the appressorium shown in (E). Arrow indicates a fluorescent ring surrounding the brightly fluorescing pore. (H, I) Fluorescence overlays recorded with identical settings focused on appressorial pores (H) or biotrophic hyphae (BH) formed beneath a penetrated appressorium (arrow). (J) Median section through an appressorium viewed with transmission electron microscopy (fixed with glutaraldehyde-osmium tetroxide and embedded in epoxy resin). A penetration hypha evaginates from the pore (P). An additional layer of the appressorial wall (asterisk) forms a thickened ring (arrowheads) around the pore, continuous with the penetration hypha wall. PW, plant cell wall. (K) Immunogold labelling of an appressorial pore (arrow) using antibodies recognizing mRFP (cells fixed in formaldehyde-glutaraldehyde and embedded in acrylic resin). PW, plant cell wall. WD, host cell wall deposits. (L) Scanning electron microscope image showing attached turgid appressorium (A) and collapsed conidium (C) on a leaf surface. (M) Plant-exposed underside of detached appressoria with penetration pores (black arrows) and remnants of extracellular matrix and/or plant cuticle (white arrow). (N, O) Penetration sites from which appressoria were detached completely. (N) The lobed outline of a former appressorium is still visible (arrowheads) with a mark representing the penetration point (arrow). (O) Micrograph series representing different focal planes as fluorescence overlay (top panels) and corresponding black on white conversion of the fluorescence channel (bottom panels), focusing from the penetration point (left) downwards into the plant cell wall (right). Arrow: inserted penetration hypha. (P, Q) Fluorescence overlays focused on the appressorial pore (P) and the underlying plant cell wall (Q). Arrow, anticlinal plant cell wall. Images were recorded at 24 hours post inoculation (hpi) (A–G, K, P, Q), 32 hpi (J, L–O), 40 hpi (H, I). Scale bars: 5 µm (A, H, L, N, O, P) and 2 µm (C, E, M), 1 µm (J), 500 nm (K). See also Figure S4.

