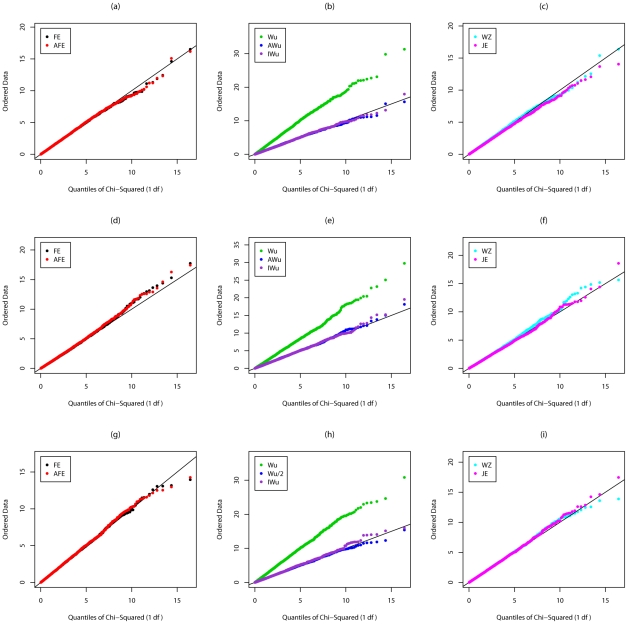
Figure 1. Chi-squared (1 df) Q-Q plot for Scenario 1 (Global Null).
Top panels ((a), (b) and (c)): Case/Control not in LD; Middle panels ((d), (e) and (f)): Case/Control in LD; Bottom panels ((g), (h) and (i)): Case-Only not in LD; FE: Fast-Epistasis; AFE: Adjusted FE; Wu: Wu et al. statistic; AWu: Adjusted Wu statistic; IWu: Ideal Wu statistic; WZ: Wellek and Ziegler statistic; JE: Joint Effects statistic.

