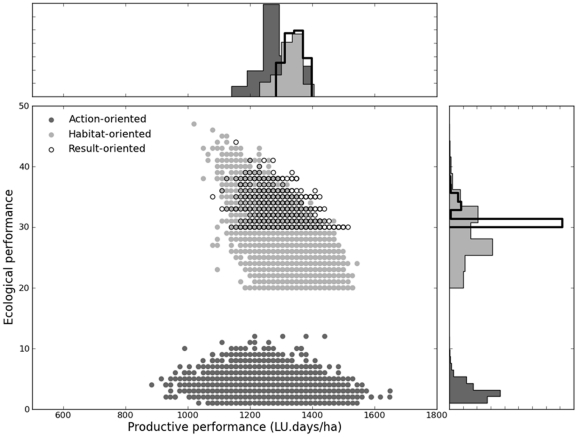
Figure 2. Ecological performance N(T) and productive performance P(u,T) and histograms of distributions of action-oriented, habitat-oriented and result-oriented.
For each scenario, results are plotted for a sample of 10 000 couples of viable state trajectories and viable grazing strategies. The action-oriented scenario (dark gray) is run with cattle density constraint (ub = 0.5; u# = 2 livestock units per hectare); the habitat-oriented scenario (light gray) is run with fecundity and habitat quality constraints (fb = 2.5, hb = 0 cm and h# = 14 cm); the result-oriented scenario (empty black) is run with minimum population size (Nb = 30); all, scenario involve constraints on productive performance and cattle feeding requirement; all scenarii are run with initial population size N(t0) = 30.

