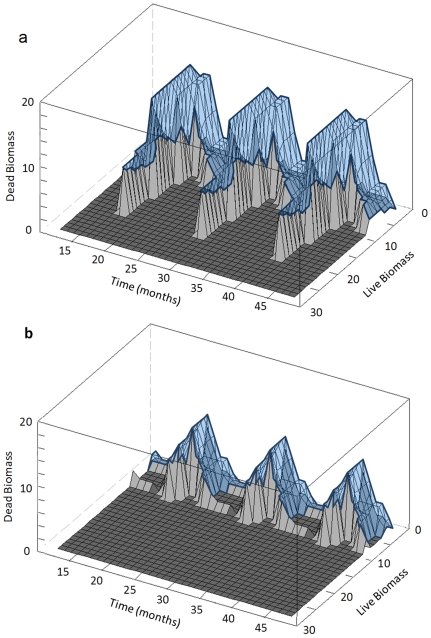
Figure 3. Zoom on three years of the viability tubes (VTRO and VTHO) for the result-oriented (fig a) and habitat-oriented (fig b) scenarios.
The tubes show the set of viable states throughout time (in months). The two state dimensions are the live biomass and the dead biomass both expressed in organic matter (10−4 g OM ha−1). The viability tube corresponds to the volume (in blue) between the light gray surface and the wireframe. Dark gray areas are the ones for which no viable state exists.

