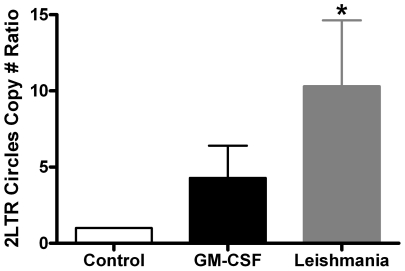
Figure 6. 2LTR circle copy number ratio.
The different treatment groups were treated with the D3 GFP vector. At 48 h after transduction, total cellular DNA was collected and analyzed by real-time PCR. The control group for each donor was set to 1 and then compared to GM-CSF- and Leishmania-maturated MDMs groups. Mean and SEM are plotted. The significantly different group (p<0.05), as compared to control, is indicated with an asterisk. Seven independent donors were analyzed.

