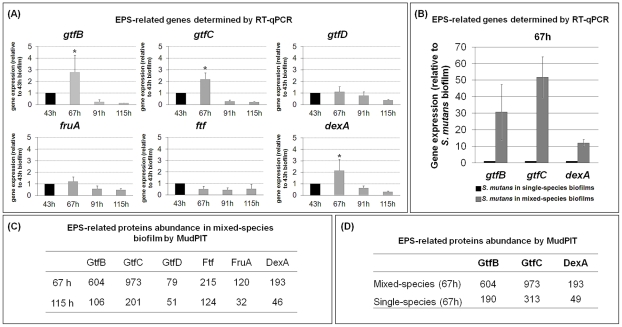
Figure 2. Expression of Streptococcus mutans EPS-associated genes and proteins during mixed-species biofilm development.
(A) This panel shows RT-qPCR analysis of gtfB, gtfC, gtfD, fruA, ftf and dexA gene expression by S. mutans in mixed-species biofilms at specific time points after introduction of 1% (w/v) sucrose. The data shown are mean values ± s.d. (n = 12). The asterisks (*) indicate that the expression level of gtfB, gtfC (at 67 h) is significantly different from other time points (P<0.05, Tukey-Krammer HSD). (B) This panel displays RT-qPCR analysis of gtfB, gtfC, and dexA gene expression by S. mutans in single- or mixed-species biofilm at 67 h, after introduction of 1% (w/v) sucrose. The data shown are mean values ± s.d. (n = 12). The expression level of the specific S. mutans genes is significantly different between single- and mixed-species biofilms (P<0.05). (C) This panel contains MudPIT analysis of expression of EPS-related proteins by S. mutans in mixed-species biofilms at specific time points after introduction of 1% (w/v) sucrose (n = 2). Spectral counts were used for quantification of proteins in each of the time points tested; standard deviations for protein data are not shown in the table. (D) This panel depicts MudPIT analysis of the abundance of GtfB, GtfC, and DexA by S. mutans in single- or mixed-species biofilms at 67 h after introduction of 1% (w/v) sucrose (n = 2). Spectral counts were used for quantification of proteins in each of the time points tested; standard deviations for protein data are not shown in the table.

