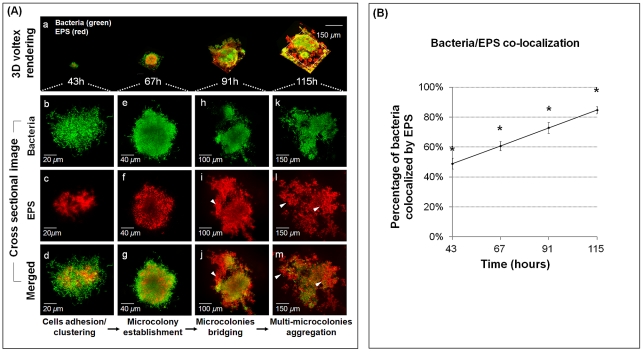
Figure 4. Structural arrangement between EPS and bacterial cells during the assembly of surface-attached EPS-microcolony complex.
(A) This figure gives representative images of 3D renderings of mixed-species biofilms after introduction of 1% (w/v) sucrose. Panel (a) shows the dynamic evolution of surface-attached microcolonies over time. Panels (b–m) show cross sectional images of selected area for close-up views of the structural organization of EPS (red) and bacterial cells (green) during the development of an EPS-microcolony complex. The arrows indicate EPS bridging (i, j) and providing support for aggregation of multiple microcolonies (l, m). (B) The amount of co-localization between bacteria and EPS was calculated using DUOSTAT. The graph shows the percentage of bacteria and EPS colocalized within the biofilm over time (mean values ± s.d; n = 15). The asterisks (*) indicate that the values from each time point are significantly different from each other (P<0.05, Tukey-Krammer HSD).

