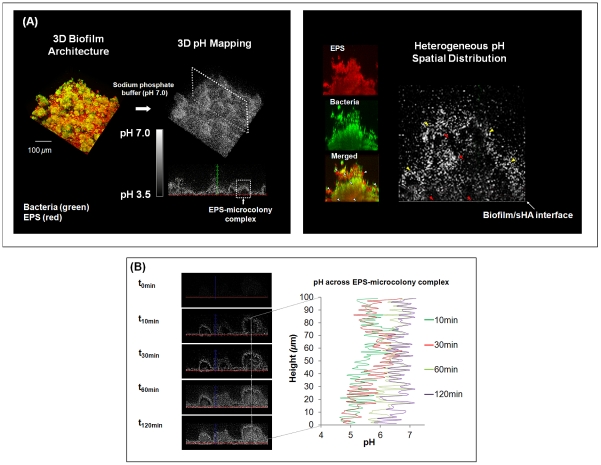
Figure 5. Three-dimensional pH mapping of intact mixed-species biofilm.
(A) This figure displays representative images of the pH profile throughout the biofilm 3D architecture and the spatial distribution of pH within the selected EPS-microcolony complex in mixed-species biofilms formed after introduction of 1% sucrose. Dark areas are indicative of regions of low pH, while white or light areas are indicative of regions of pH that are close to neutral, as indicated by the scale bar. The EPS channel is depicted in red, while the cells are depicted in green. Arrows indicate various acidic pH regions within the microcolony and at the sHA interface. Red arrows indicate acidic pH regions (i) across the structure and (ii) at the microcolony/sHA interface. Yellow arrows indicate pH close to neutral at the microcolony/fluid phase interface. White arrows indicate the corresponding pH landmarks in the merged panel. (B) This panel shows temporal changes of in situ pH across the EPS-microcolony complex after the biofilm was exposed to sodium phosphate-based buffer (pH 7.0) for a total of 120 min.

