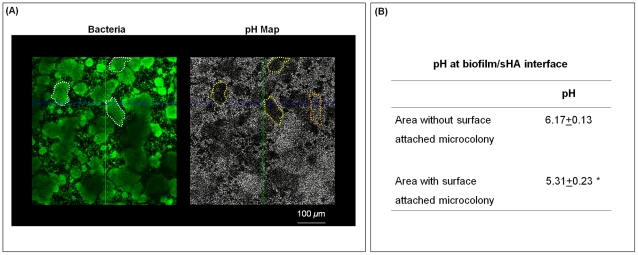
Figure 6. In situ pH mapping at the EPS-microcolony complex and sHA interface.
(A) This figure shows representative cross sectional images (bird's eye view) at the sHA surface. White marks indicate the areas with surface-attached microcolonies (in the bacteria channel; depicted in green) while yellow marks show the corresponding area in the pH channel; the orange mark indicate an area without surface-attached microcolony. Dark areas are indicative of regions of low pH, while white or light areas are indicative of regions of pH that are close to neutral. (B) This table shows the pH values at the sHA interface for areas with and without surface-attached microcolonies after 30 min incubation in sodium phosphate-based buffer (pH 7.0). The data shown are mean values ± s.d. (n = 90). The asterisks (*) indicate that the differences between the two conditions are statistically significant (P<0.05, Tukey-Krammer HSD).

