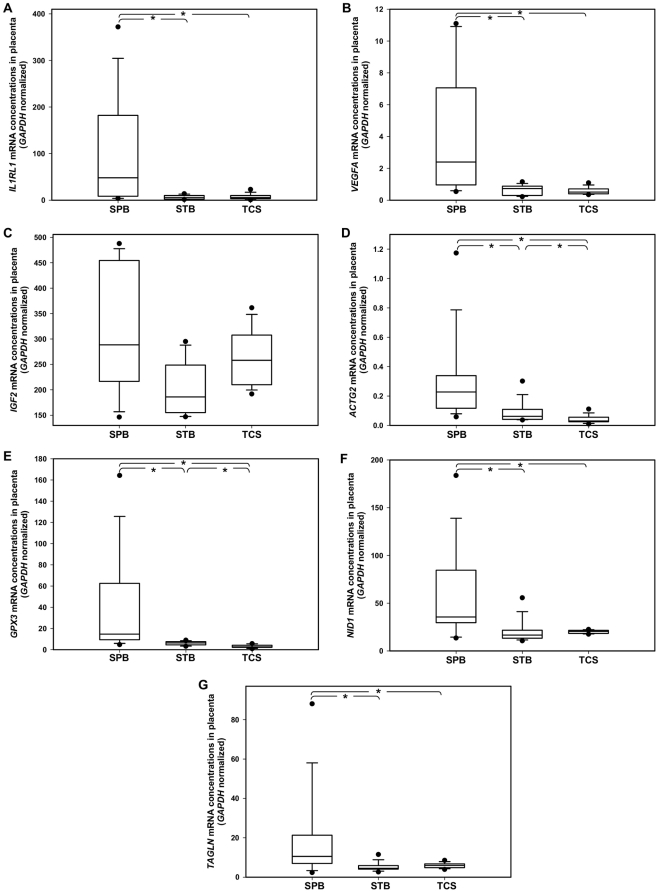
Figure 2. Box plots of the concentrations of RNA transcripts in the placentas as determined by RT-qPCR.
Seven transcripts (A–F) with different fold-change values on the microarray dataset were selected for further investigation by RT-qPCR in the placentas collected from SPB, STB and TCS. The line inside each box denotes the median. Limits of the box denote the 25th and 75th percentiles. Whiskers denote the 10th and 90th percentiles. Filled circles denote the 5th and 95th percentiles. Asterisks denote the any pairwise comparisons that are significantly different (p<0.05, the Student-Newman-Keuls test). SPB, spontaneous preterm birth. STB, spontaneous term birth. TCS, elective term cesarean delivery.

