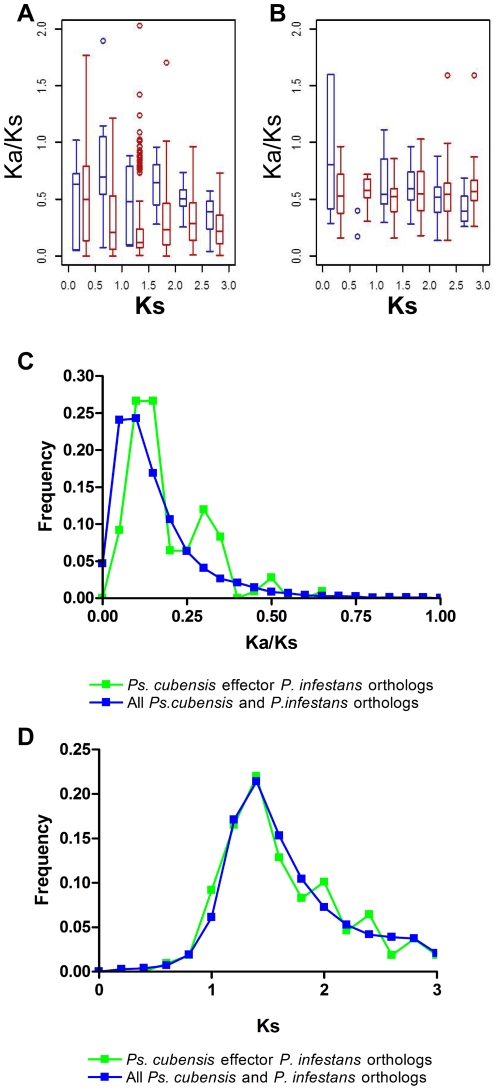
Figure 1. Strength of purifying selection on Pseudoperonspora cubensis effectors.
Comparison of selective constraints on effector paralogs (blue) and all other genes (red) in (A) Ps. cubensis and (B) P. infestans. Frequency distributions (C) of ω, the ratio between the nonsynonymous substitution rate (Ka) and the synonymous substitution rate (Ks) of Ps. cubensis and P. infestans sequence pairs. Distributions of Ks values (D) of Ps. cubensis and P. infestans sequence pairs. Green symbols indicate Ps. cubensis effector – P. infestans non-effector ortholog pairs. Blue symbols represent other orthologous gene pairs between the two species.

