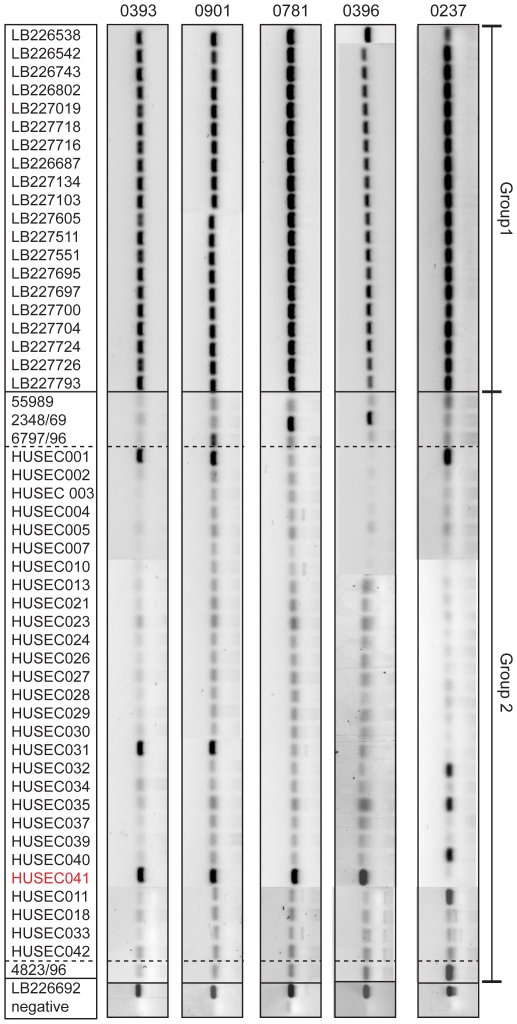
Figure 3. PCR amplicons from the E. coli clinical isolates, grouped by primer set.
Composite (negative) images from multiple agarose gels have been aligned against the matching isolate designation (left hand column) and below the primer names (top row). The image has been split so that Group 1 isolates are located in the top section, Group 2 isolates in the second and the positive and negative controls at the bottom. The HUSEC isolates within Group 2 are bounded by dashed lines and E. coli HUSEC041 indicated in red font.

