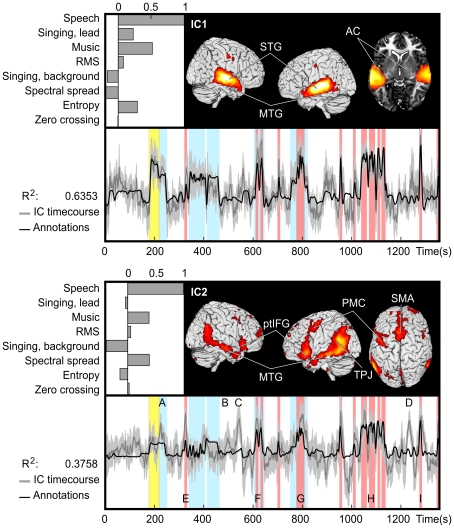
Figure 4. The two ICs that were found to be sensitive to auditory features in the movie.
IC1 (top) encompassed bilaterally the auditory cortex (AC), superior temporal gyrus (STG), middle temporal gyrus (MTG), and relatively small activation foci in or in the vicinity of the lip representation in primary motor cortex. The normalized weights used to fit the auditory feature model to IC activity are shown in the upper left corner. The time course of the fitted stimulus model (black), mean time course (dark gray), and 95% confidence interval (light gray) of the IC are overlaid below. R2 indicates the coefficient of determination of the stimulus model and IC’s temporal behavior. Vertical bars show time intervals when there is speech (red), singing (yellow), and music (blue) in the sound track. IC2 (bottom) includes the MTG and inferior frontal gyrus/pars triangularis (ptIFG) in both hemispheres as well as the left temporoparietal junction (TPJ), left premotor cortex (PMC) anterior to the motor cortex cluster of IC1, and the supplementary motor area bilaterally (SMA). A–D indicate examples of instances at which activation is not explained by the auditory model while E–I highlight moments containing speech and show peaks in brain activity. Activity patterns during these instances are shown in Figure 6.

