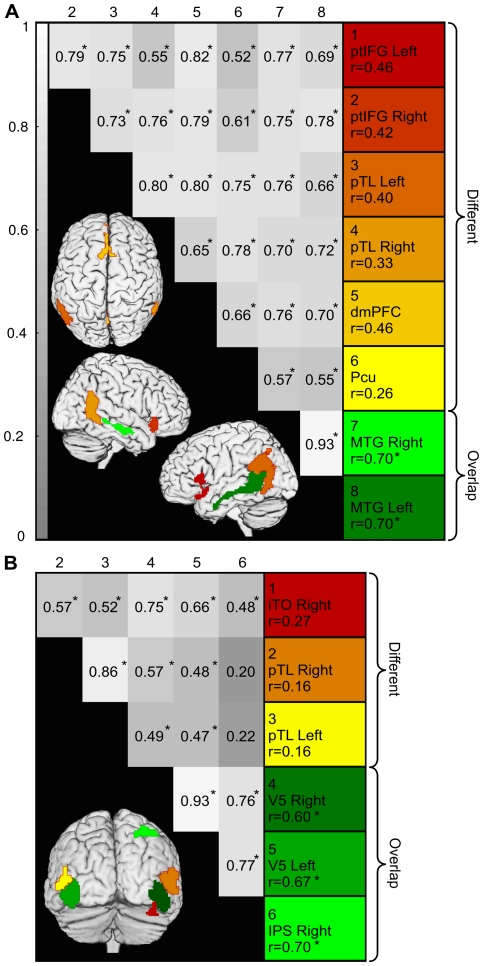
Figure 10. Comparison of overlapping vs. non-overlapping ROIs in ICA and voxel-wise GLM results.
A: Comparison of speech sensitive IC2 and areas correlated with the auditory model in the voxel-wise analysis. LEFT: Areas where ICA and voxel-wise results differed are color-coded with red–yellow, and overlapping areas are green. Pair-wise correlation matrix of the mean time courses of each ROI is presented on grey background, where the brightness of the grey shade corresponds to the correlation coefficient. Asterisks indicate significant correlations. RIGHT: The correlation coefficients of the auditory model with each ROIs time courses. Color coding corresponds to the colors on the brain images. All ROIs correlated strongly with each other, but only the ROIs which were present in both ICA and voxel-wise results are significantly correlated with the auditory model. B: Comparison of motion sensitive IC4 with voxel-wise results. Details as in A; iTO refers to inferior temporo-occipital ROI. Non-overlapping ROIs are not significantly correlated with the stimulus model, but all ROIs are significantly correlated with the activity of the strongest clusters of IC4 centered on the area V5.

