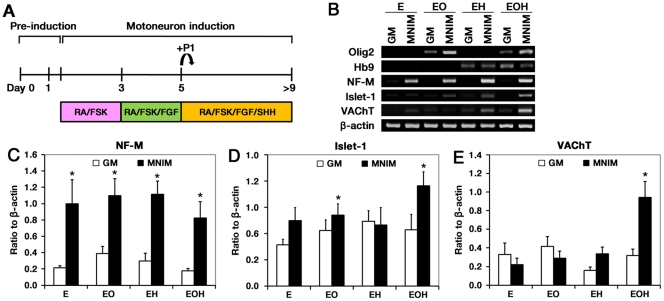
Figure 1. MN marker gene expression in hMSCs expressing Olig2 and Hb9 in the presence of MNIM.
(A) Schematic illustration of the protocol used for MN induction of hMSCs. (B) RT-PCR analyses of hMSCs expressing EGFP (E), EGFP-Olig2 (EO), EGFP-Hb9 (EH), and EGFP-Olig2-Hb9 (EOH) with MNIM treatment were preformed. Quantification of NF-M (C), Islet-1 (D), and VAChT (E) PCR products. The mRNA level of a given gene was quantified by densitometry and normalized to the corresponding β-actin level. The bars represent mean±SEM of at least three independent experiments. *P<0.05 versus uninduced E. The significance was determined by Mann-Whitney test with Fisher’s LSD post hoc test.

