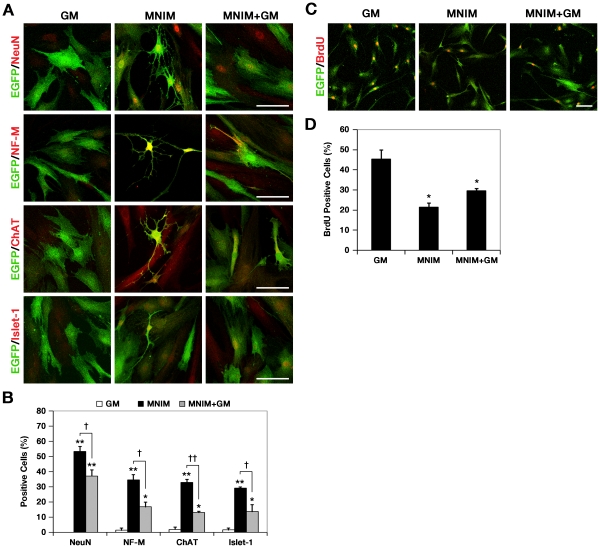
Figure 3. Increased expression of mature neuronal/motoneuronal markers and cell-cycle arrest occur in MNIM-treated EOH.
cells. (A) Immunocytochemistry analysis of neuronal and MN-specific markers in uninduced EOH cells, MNIM-EOH cells, and MNIM-EOH cells further cultured in growth medium for 2 days after complete induction. Each row represents NeuN (red), NF-M (red), ChAT (red), and Islet-1 (red) staining with EGFP (green). Scale bar: 50 µm. (B) Quantitative analysis of NeuN, NF-M, ChAT, and Islet-1 expression. Fifty to 150 cells per group were analyzed in randomly chosen fields. The bars represent mean±SEM of at least three independent experiments. * P<0.05, ** P<0.001 versus GM. † P<0.05, †† P<0.001 versus MNIM. The significance was determined by ANOVA followed by Fisher’s LSD post hoc test. (C) Immunocytochemistry of BrdU incorporation (red) and EGFP (green) in EOH cells cultured in GM, MNIM, and MNIM+GM. (D) Quantitative analysis of BrdU incorporation. Fifty to 150 cells per group were analyzed in randomly chosen fields. The bars represent mean±SEM of at least three independent experiments. * P<0.05 versus GM. The significance was determined by ANOVA followed by Fisher’s LSD post hoc test.

