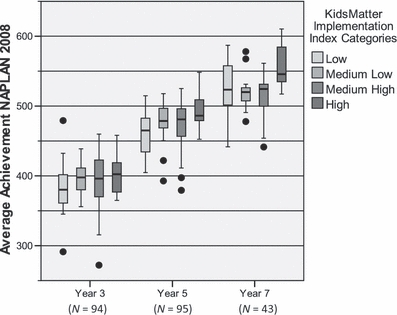
Figure 2.

Distribution of Years 3, 5 and 7 NAPLAN achievement scores in 2008 according to level of KidsMatter Implementation quality

Distribution of Years 3, 5 and 7 NAPLAN achievement scores in 2008 according to level of KidsMatter Implementation quality