
Figure 3.
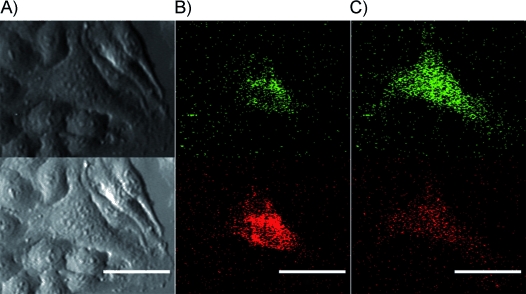
In-cell cleavage of compound 9 following microinjection into HeLa cells. The image was cast onto the upper and lower halves of the CCD sensor by using an image splitter (Optical Insights). Top: GFP emission, bottom: rhodamine emission. A) DIC image immediately before injection. B) Fluorescence image immediately after injection. C) Fluorescence image 10 min after cleavage. Scale bars=5.0 μm.