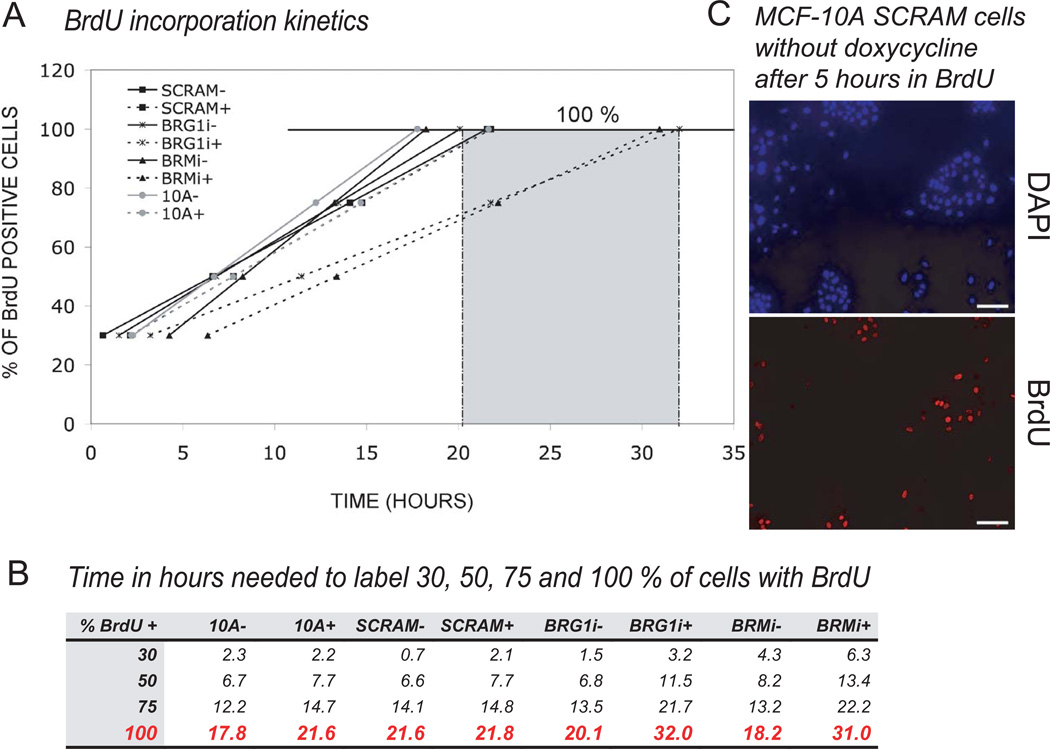
Figure 7. The knockdown of BRG1 or of BRM increased the length of the cell cycle as determined by pulse labeling with BrdU.
(A) Cell cycle length was measured from a time course of BrdU incorporation. The graph plots the percent of BrdU positive cells as a function of time in hours. A linear extrapolation to the time when 100 % of cells were BrdU positive cells calculated the mean length of a single cell cycle.
(B) Calculated according to the linear regression method, the time in hours needed for 30, 50, 75 and 100 % of cells to become BrdU positive.
(C) A representative micrograph from which the measurements of panels A and B were made shows MCF-10A cells with the SCRAM control shRNA in absence of doxycycline after 5 hours in BrdU. The number of BrdU positive cells (lower) and the number of total cells (upper, DAPI fluorescence) were counted. Seven fields were analyzed for each group in each of two independents experiments.

