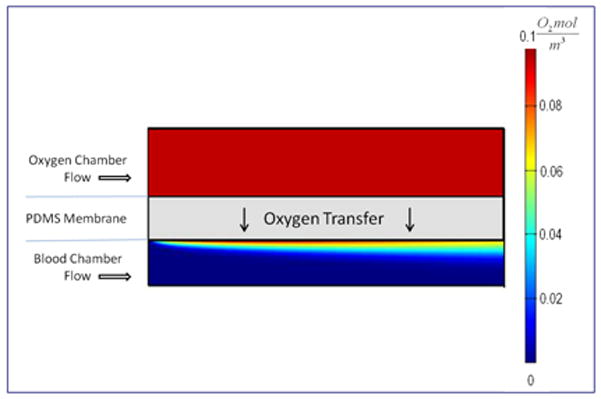
Figure 2.

Oxygen distribution within a small section of the computational domain. The model was run with oxygen and blood flowing in the same direction at different flow rates. The color map indicates the oxygen concentration within both the blood and oxygen chambers; oxygen concentration in the membrane is not shown (Not drawn to scale).
