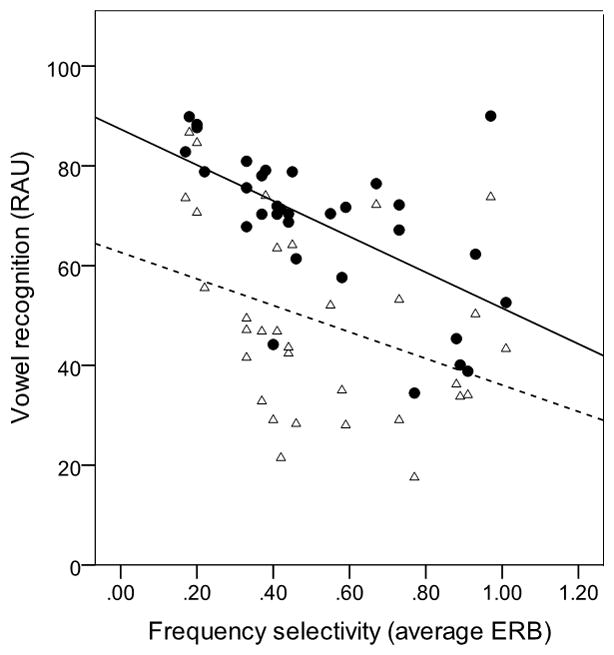
Figure 3.

Relationship between auditory filter and performance. Values on the abscissa are average of normalized ERB at .5 and 2 kHz, where normalized values are calculated as ERB (in Hz) divided by tone frequency (in Hz). Values on the ordinate are vowel identification scores expressed as rationalized arcsine units. Linear data are plotted as filled circles and MCC data as open triangles. The best-fit lines illustrate the trend for linear (solid line) and MCC (dashed line).
