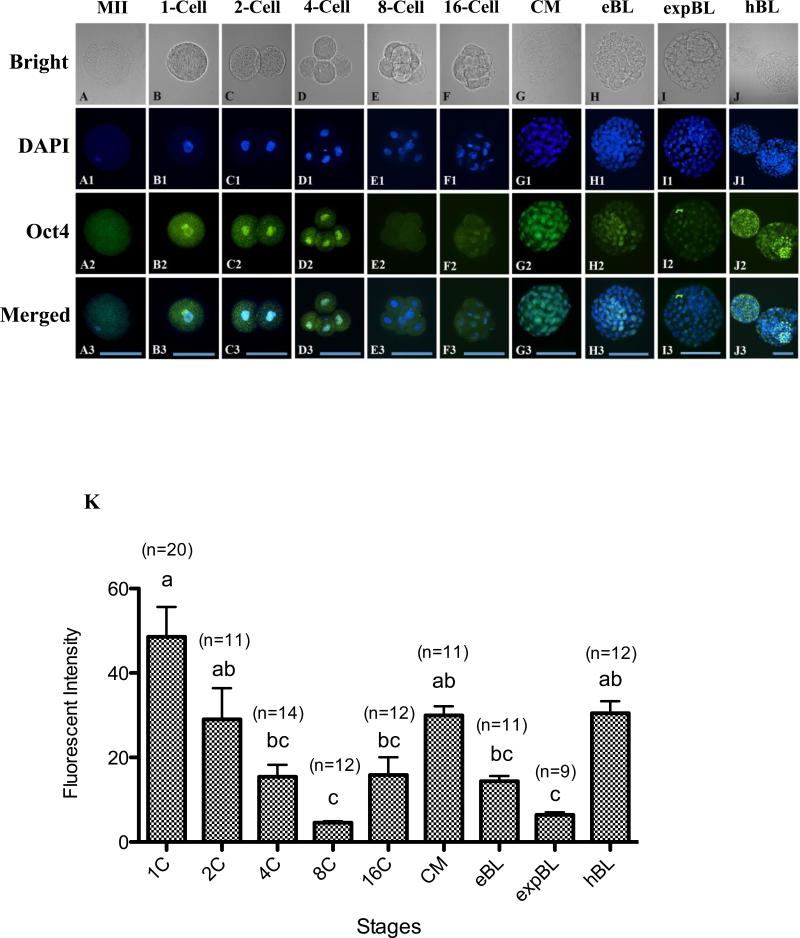
Figure 1.
(A–J3) Oocytes and embryos at different stages doubly labelled for DNA (4(,6-diamidino-2-phenylindole); DAPI; blue) and Oct-4 (green). Oct-4 staining of metaphase-II oocytes (MII) showed visible but diffuse signals distributed throughout the cytoplasm (A–A3). Oct-4 signals were detected both in the cytoplasm and the nuclei of zygotes (B–B3) and 2-cell (C–C3) and 4-cell (D–D3) embryos. A very weak Oct-4 signal was found in the cytoplasm and diminished in the nuclei of 8-cell embryos (E-E3). Nuclear Oct-4 staining was evident again at the 16-cell stage (F–F3) and became more intense at the compact morula stage (CM; G–G3). A wave of Oct-4 signal intensity change was observed in blastocyst embryos (H-J3): the average intensity of Oct-4 signal decreased at the early blastocyst stage (EB; H–H3), reached a minimum at the expanded blastocyst stage (EXPB; I–I3) and spiked at the hatching blastocyst stage (HB; J–J3). Bars = 100 μm (A–J3). (K) Quantification of Oct-4 intensity at different stages of in-vitro cultured rabbit embryos. Values are mean ± SEM. Numbers of embryos used for each stage are indicated above each bar. Different letters (a–c) indicate a statistically significant difference (P < 0.05).

