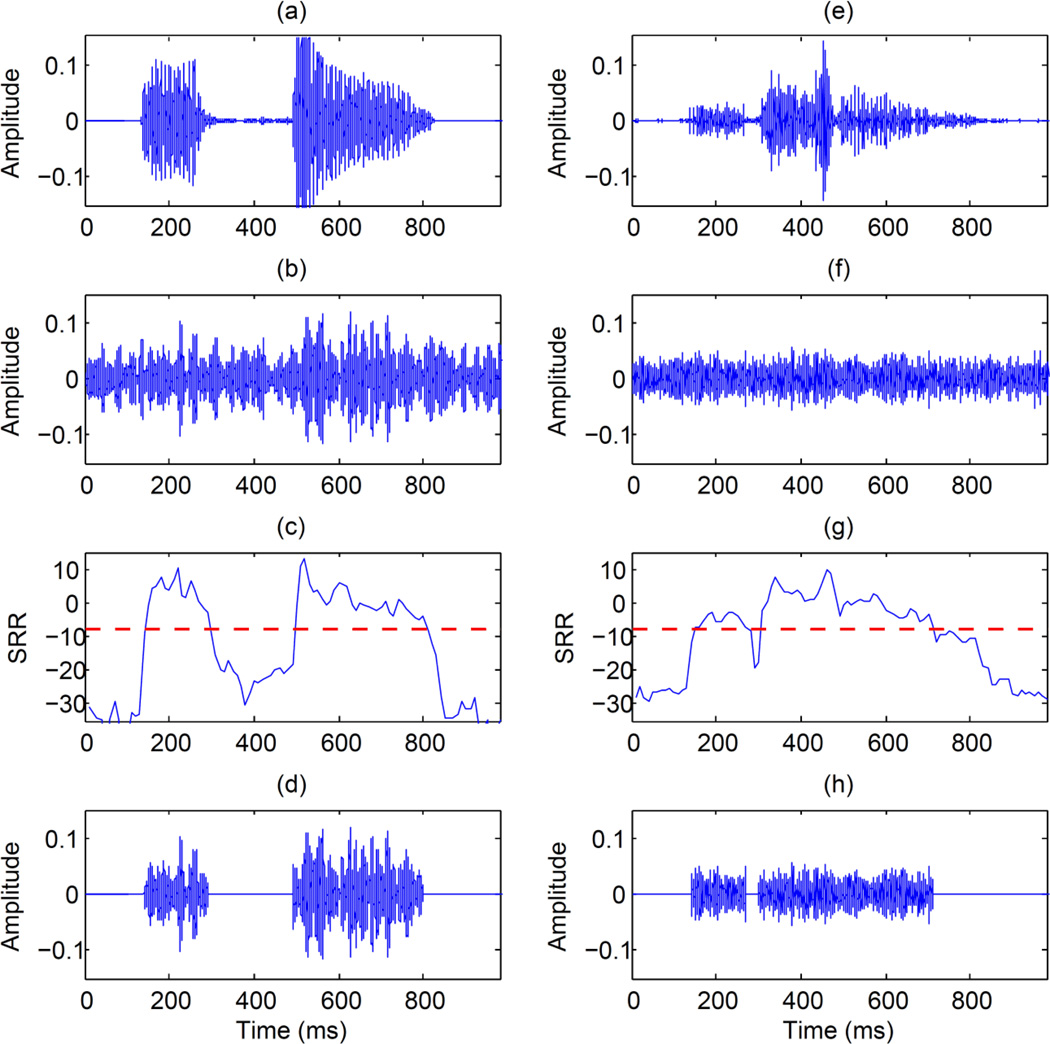
Figure 3.
Panels in the left column show band-pass filtered waveforms of “asa” in a low-frequency channel (f = 500 Hz, bandwidth = 81 Hz) and panels in the right column show band-pass filtered waveforms in a high-frequency channel (f = 3060 Hz, bandwidth = 418 Hz). Panels (a) and (e) show the clean waveforms, panels (b) and (f) show the reverberant+noise (1.0 s, 5dB) waveforms, panels (d) and (h) show the reverberant+noise (1.0 s, 5dB) waveforms processed by ICS with T = −8 dB. Panels (c) and (g) show the instantaneous SRR values (horizontal line indicates the fixed threshold set at −8dB).

