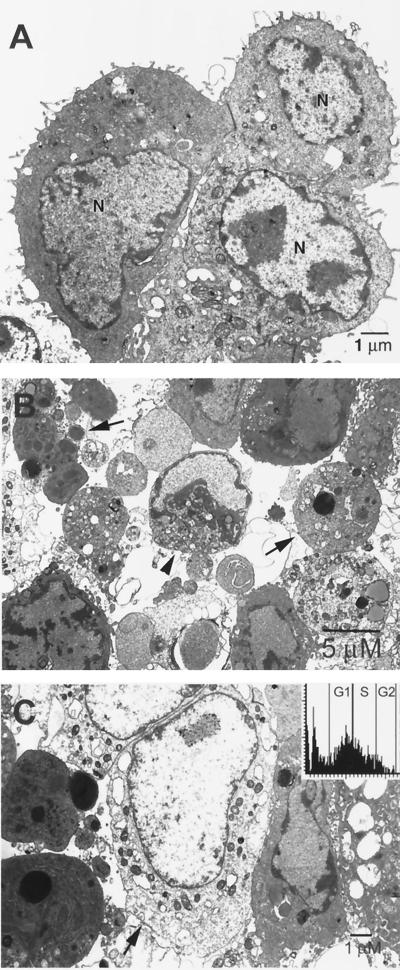
Figure 4.
Electron transmission microscopy of mIMCD3 cells. (A) Control. (B and C) Cells exposed to 2 mM APAF for 36 h. B shows both early (arrowhead) and late stages (arrows) of apoptosis. In the early stage of apoptosis there is limited cell shrinkage and nuclear condensation, and in the late stage of apoptosis not only are the cells contracted, but the nuclear condensation is advanced and apoptotic bodies appear. C shows both an oncotic cell and several apoptotic cells. The oncotic cell (Center) has a swollen nucleus and a degraded nucleolus. The apoptotic cells have greatly condensed nuclei. (Inset) A cytogram by LSC with 2 mM APAF. Most cells are arrested in late G1 and early S. Moreover, there are many oncotic cells whose nuclei have subdiploid DNA staining.

