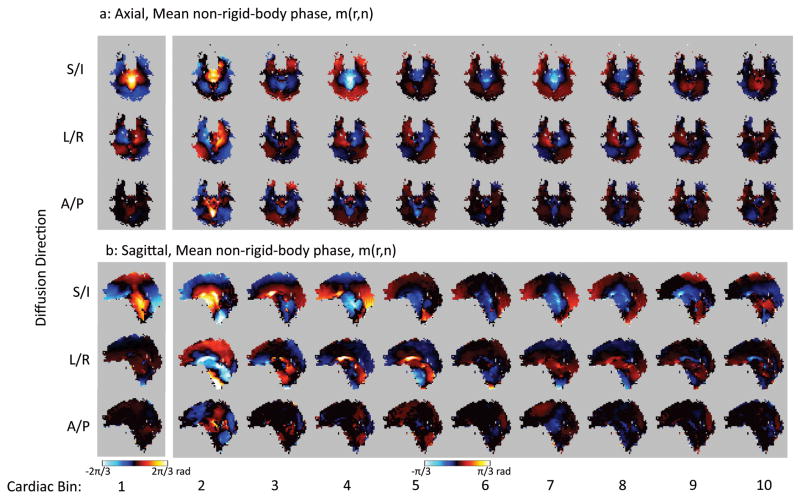
Figure 6.
A comparison of the mean non-rigid-body phase maps from the axial (a) and sagittal (b) slices from subject 1. Note that cardiac bin 1 (corresponding to systole) is windowed differently from the other cardiac bins since the phase values are lower in the diastolic portion of the cardiac cycle.

