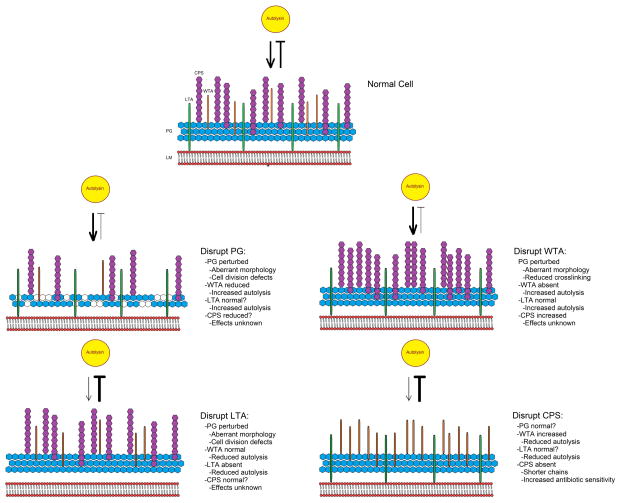
Figure 2.
Proposed model detailing the pleiotropic effects caused by disruption of individual components of the cell surface. LM: Lipid membrane; PG: peptidoglycan; LTA: lipoteichoic acid; CPS: capsular polysaccharide; WTA: wall-teichoic acid. Yellow circle represents an autolysin. Bold lines indicate an increase in function, while narrow lines indicate a decrease in function.

