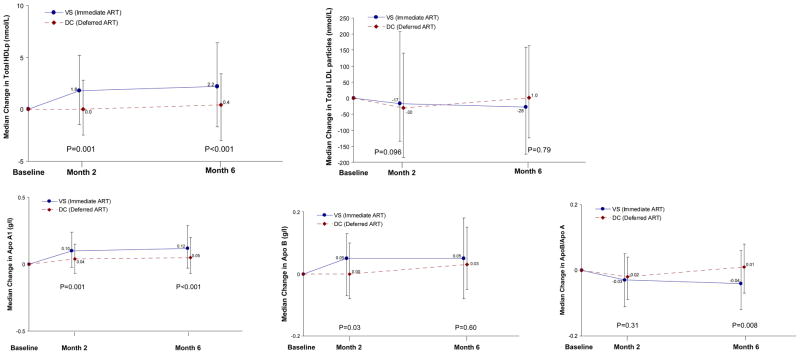
Figure 1. Change in Lipoprotein Particle Concentrations and Apolipoproteins.
Change in total HDL-P concentration, ApoA1 level, ApoB level, and ApoB / ApoA1 is presented at months 2 and 6 for VS (immediate ART) and DC (deferred ART initially) groups. Point estimates represent median change from baseline, error bars represent the inter-quartile range (IQR) for change, and p-values are included for the relative differences for VS compared to DC participants at month 2 (11.8% for HDL-P, 8.0% for ApoA1, and 5.8% for ApoB) and month 6 (12.9% for HDL-P; 8.8% for ApoA1; and −7.0% for ApoB / ApoA1).

