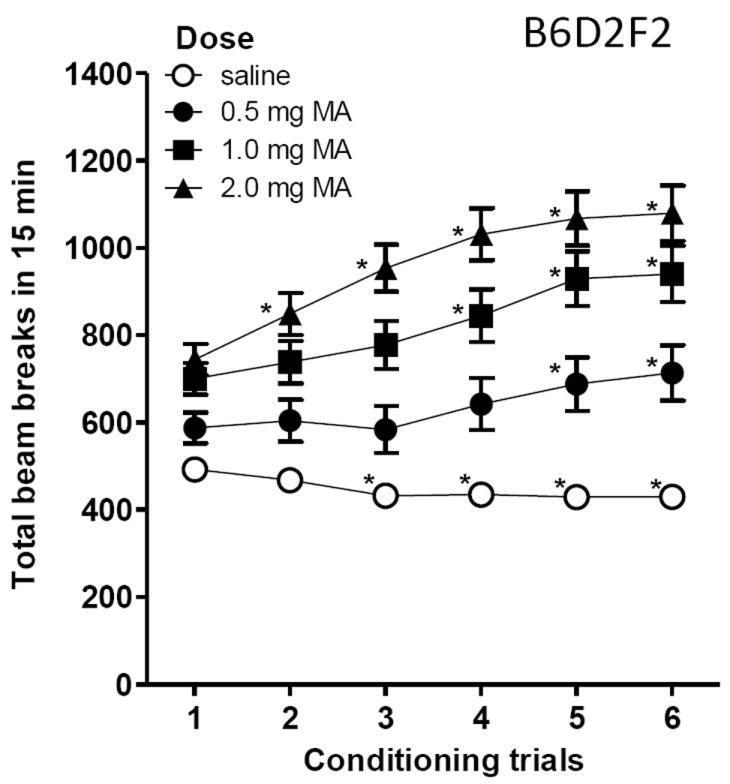
Figure 5.

Locomotor activity levels in B6D2F2 mice during the 6 conditioning trials for saline and methamphetamine (MA). Dose groups differed in the number of MA treatments required to induce locomotor sensitization. Locomotor activity was measured as photocell beam breaks during the 15-min conditioning sessions. Conditioning sessions were alternated between saline and MA in a counterbalanced order across animals. MA dose groups were independent, so there were separate saline conditioning trials for each group. Since there were no significant MA dose group effects on activity levels during the saline trials, these data are presented collapsed on MA dose group. n = 31-32 per dose. *p<.05 for the comparison of trial 1 and the indicated subsequent trial. Bars and error bars are means ± SEM. Note: some error bars are hidden by the symbols.
