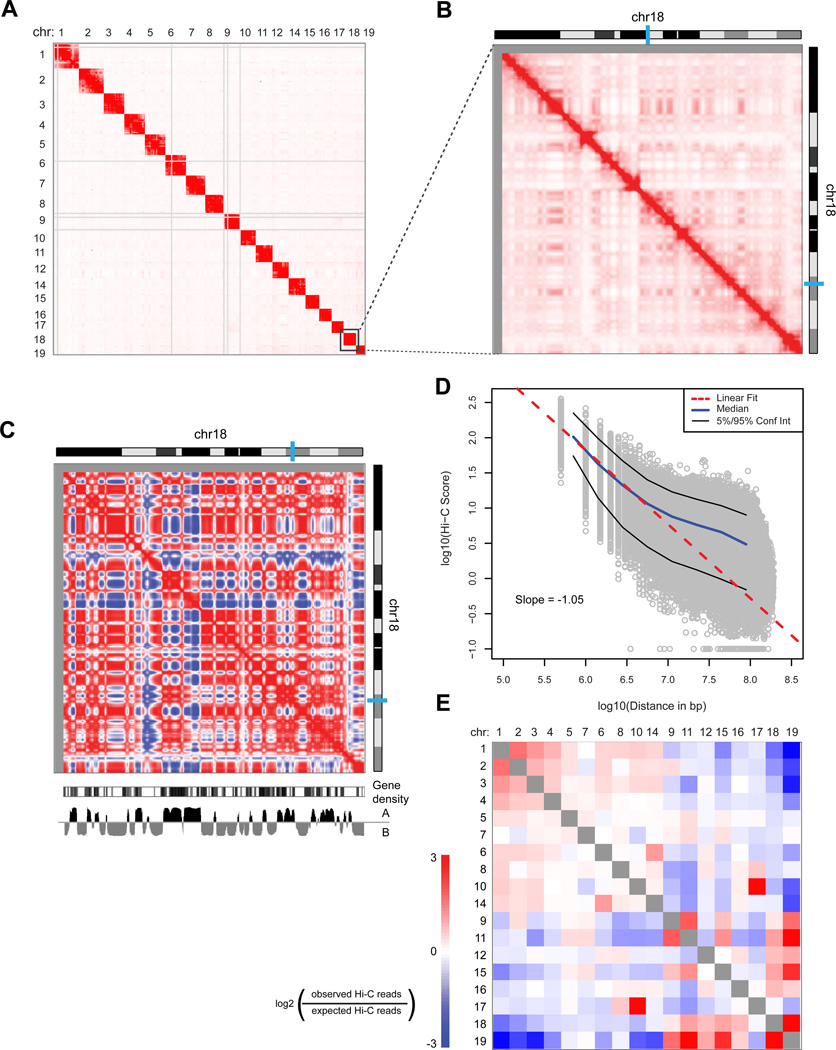
Figure 5. Hi-C analysis of G1 arrested mouse pro-B cell genome spatial organization.
A) Heatmap representing the genome-wide chromatin interaction map at 10 Mb resolution. Color intensity indicates the corrected number of Hi-C sequencing reads from each pair of interacting fragments. Regions with many large restriction fragments (>100 kb) or no uniquely mapped reads are shown in gray. B) Higher resolution map (1 Mb bins smoothed with a 200 kb step size) of intra-chromosomal interactions along chr18. C) Correlation map of chr18 at 1 Mb resolution shows chromosome compartmentalization. The first principal component eigenvector (below heatmap: “A” and “B” refer to active and inactive chromatin states) identifies compartments and correlates with gene density. D) In log space, the number of Hi-C contacts between two genomic loci scales linearly with the genomic distance separating the loci. The slope of −1 indicates a fractal globule polymer organization, and is observed for loci separated by 0.5 to at least 5 Mb. E) Observed/expected number of contacts between all pairs of whole chromosomes (sorted by length). Red indicates enrichment; blue indicates depletion. Chr13 is excluded due to a pre-existing translocation. All Hi-C data result from pooling all reads from 5 replicate experiments shown in Fig S5. Cell lines were A-MuLV transformed ATM−/− mouse pro-B cell lines arrested in G1 by STI571 treatment for 2 days. See Fig. S5 for WT results.

