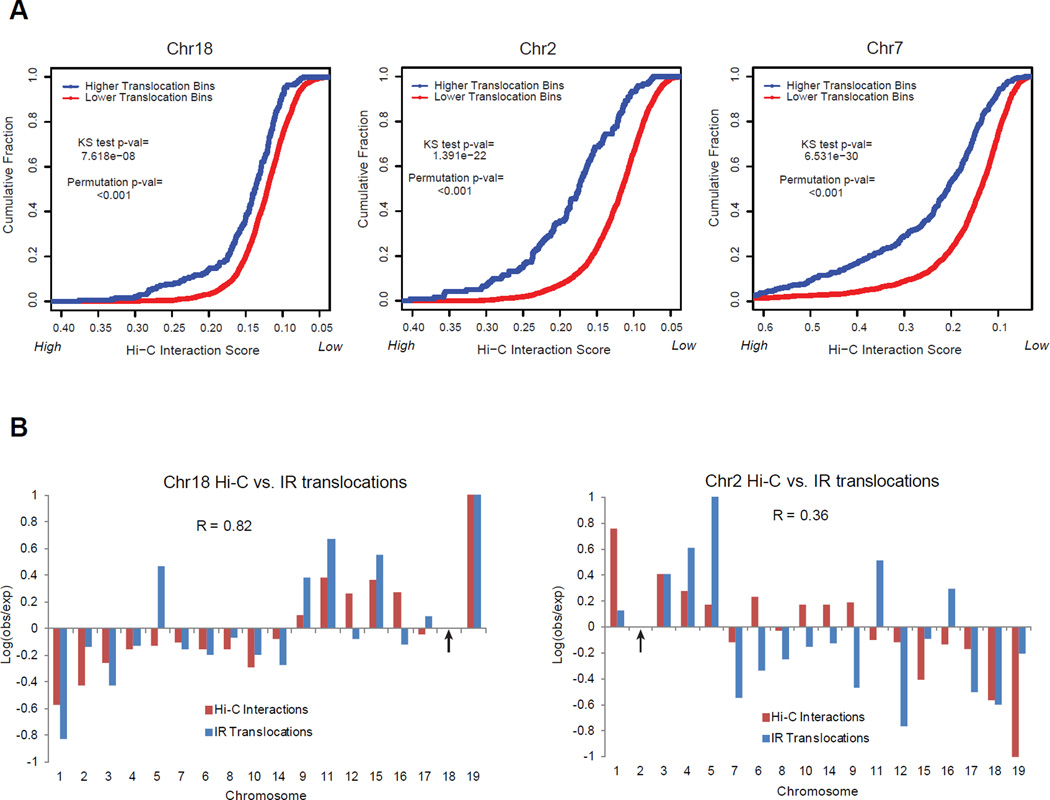
Figure 7. Translocations between chromosomes or sub-chromosomal regions are correlated with their relative spatial proximity.
A) Cumulative distributions of Hi-C interaction frequencies are shown for trans chromosome 5 Mb bins that have either “high translocations” (blue; >=2 translocations/1,000 in dataset) or “low translocations” (red; < 2 translocations/1,000 in dataset) with the I-SceI site after irradiation. A 1 Mb fixed bin around the I-SceI site is used. Hi-C scores are displayed from high-to-low. The high translocation bins have significantly higher Hi-C scores than low translocation bins (one-tailed KS test); this difference is significant compared to 1,000 random permutations of the translocation dataset (“Permutation p-val”). This result is valid for a broad range of thresholds (Fig. S7A). B) Different I-SceI targeted break locations (indicated by arrows; left: chr18, right: chr2) display different whole chromosome translocation frequency profiles (blue) that correlate (R = Pearson correlation coefficient) with their different whole chromosome proximity profiles (red). Log ratios of observed/expected translocation frequencies and Hi-C interaction frequencies between whole chromosomes (calculated as in Fig 5E) are normalized to a maximum of 1. Chromosomes are sorted by length. All Ig and TCR hotspot loci are excluded from analyses in A) and B). See also Fig. S7.

