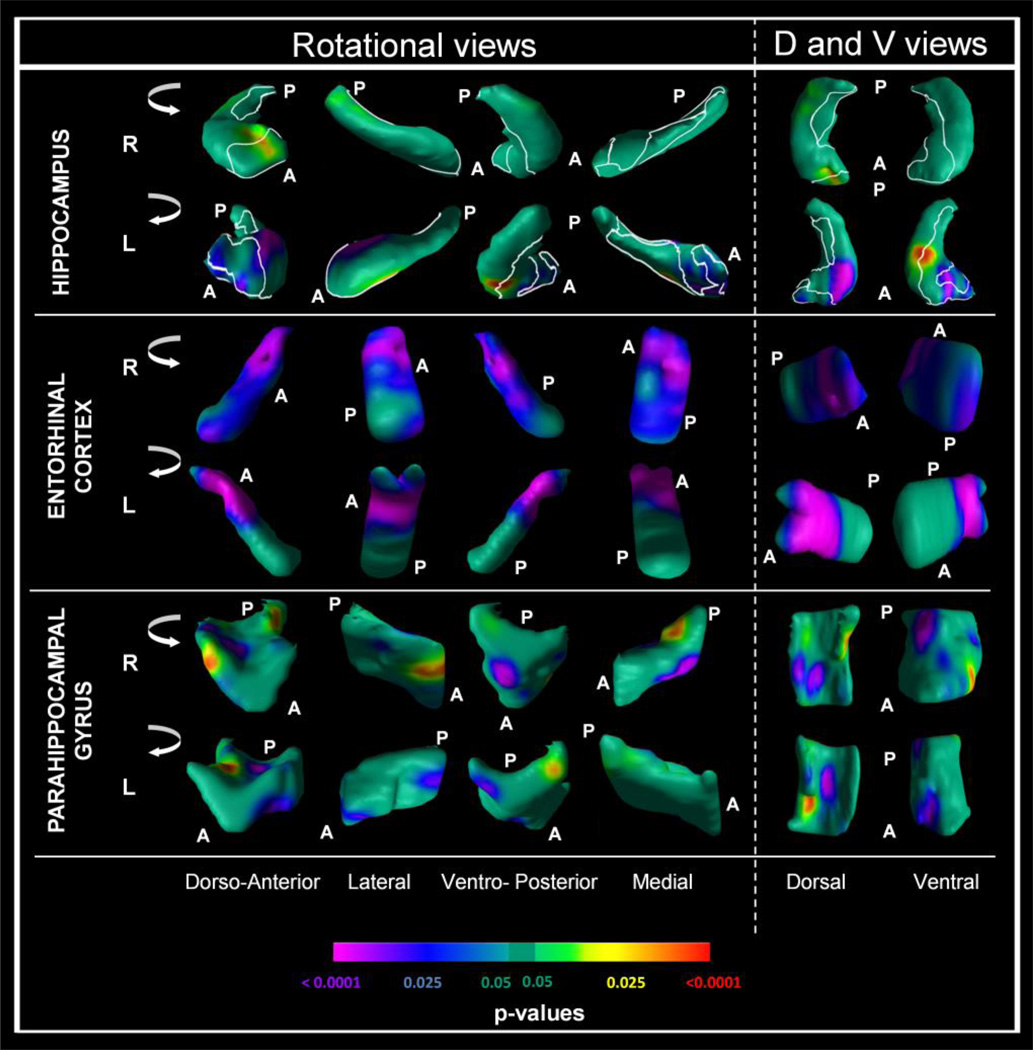
Figure 2.
Comparison of 130 patients with mild cognitive impairment (MCI) and 61 normal controls.
Analyses conducted at each point on the surface of the hippocampus, entorhinal cortex and parahippocampal gyrus, controlling for age, sex, education and intracranial volume. The right (R) and left (L) Hippocampus, right (R) and left (L) Entorhinal Cortex and the right (R) and left (L) Parahippocampal Gyrus are shown in shown in rotating views and in their dorsal (D) and ventral (V) orientations. All images reflect false discovery rate (FDR) correction for multiple statistical comparisons. The color bar indicates the color coding for P values associated with the main effect of diagnosis (MCI versus controls), with warmer colors (yellow and red) indicating protruding surfaces, presumably from larger underlying volumes, and cooler colors (blue and purple) indicating indented surfaces presumably from smaller underlying volumes in those locations.

