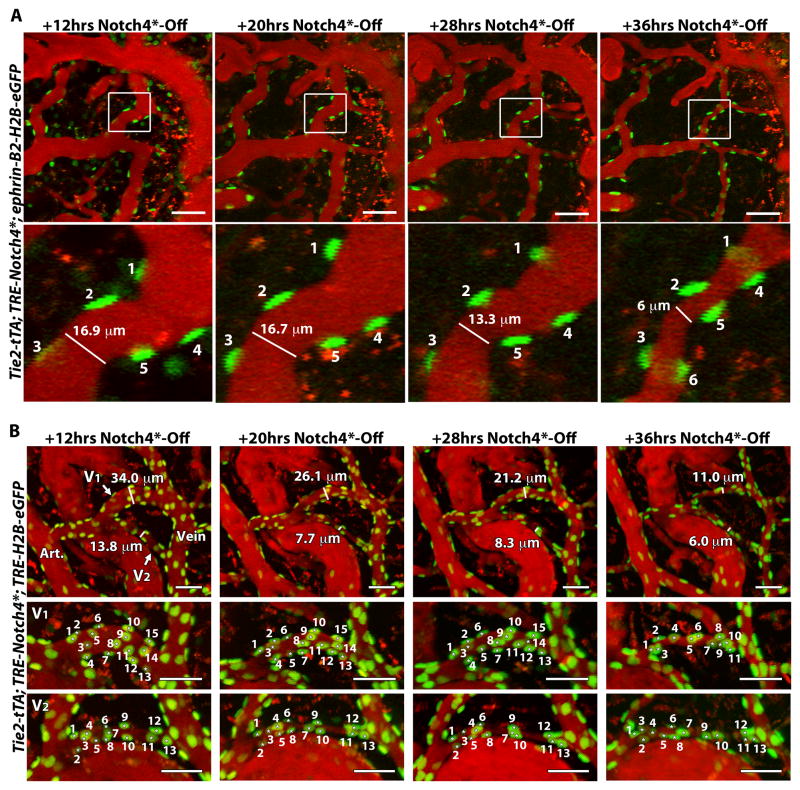
Figure 3. Regression is initiated by the loss-less reorganization of endothelial cells.
(A) Two-photon timelapse imaging through a cranial window of nuclei marked by ephrin-B2+/H2B-eGFP in a Notch4* mutant mouse. Plasma was labeled by intravenous Texas Red-dextran. In the AV shunt shown, vessel diameter was reduced by 28hrs after Notch4* repression, while the GFP+ nuclei, representing the cells, were retained at 28hrs, and even at 36hrs when vessel was further regressed. Because these images are Z-stacks through the vessel, cell 6 presented at 36hrs was also present earlier but out of the imaging plane. (B) Two-photon timelapse imaging through a cranial window of nuclei marked by Tie2-tTA/TRE-GFP in a Notch4* mutant mouse. Plasma was labeled by intravenous Texas Red-dextran. In the AV shunt shown, vessel diameter was reduced by 20hrs after Notch4* repression, while the GFP+ nuclei, representing ECs, were retained at 20hrs, and even at 28hrs when vessel was further regressed. At 36hrs further regression was evident, when some loss of was detected in the large shunt, V1, but not the smaller shunt, V2. Scale bars = 50μm.

