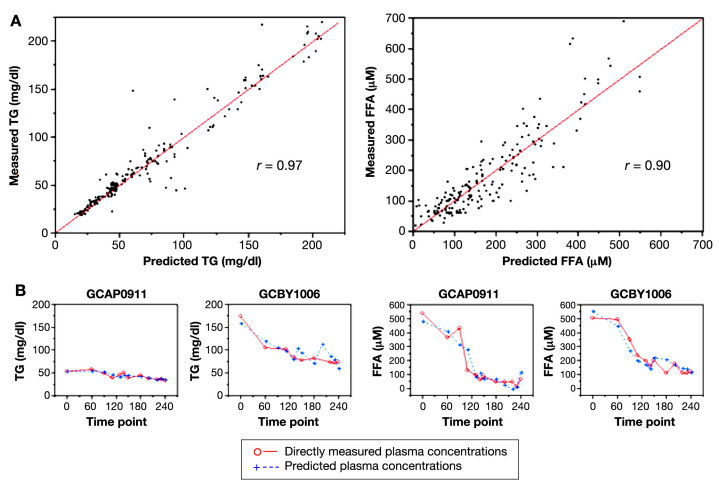
Figure 3.
Individualized prediction models of TG and FFAs during glucose/insulin infusion. (A) Plots of directly measured vs predicted plasma TG and FFA concentrations in 17 healthy young adults. A total of 12 breath and room air samples were taken for each subject during a 4 h clamp study with broad fluctuations of plasma glucose and insulin. Individualized prediction models based on multilinear regression analyses of 4-VOC clusters (2-PeONO2, CO2, CH3ONO2, and toluene for TGs, left; 2-pentanone, 2-PeONO2, butanone, MTBE for FFAs, right) demonstrated the highest overall correlation with directly measured lipid concentrations. (B) Time course of measured and predicted lipid values in two representative subjects.

