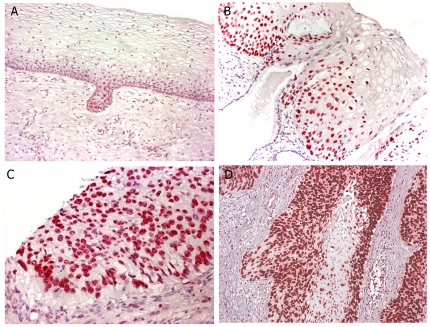
Figure 1. Correlation of MCM2 expression with the histological findings in the uterine cervix.
Panel A shows normal cervical epithelia where MCM2 is restricted to the epithelial cells at the base of the mucosal surface. Panel B shows the MCM2 pattern in a CIN 1 lesion; note that the protein in abundantly produced by the cells towards the base, but not in the cells towards the surface that show the koilocytic change classic for CIN 1. Panel C- shows the pattern of MCM2 expression in a CIN 3 lesion. Note the strong nuclear based signal present in the full thickness of dysplastic epithelia. Panel D – shows the marked increased MCM2 expression in a invasive tumor lesion.

