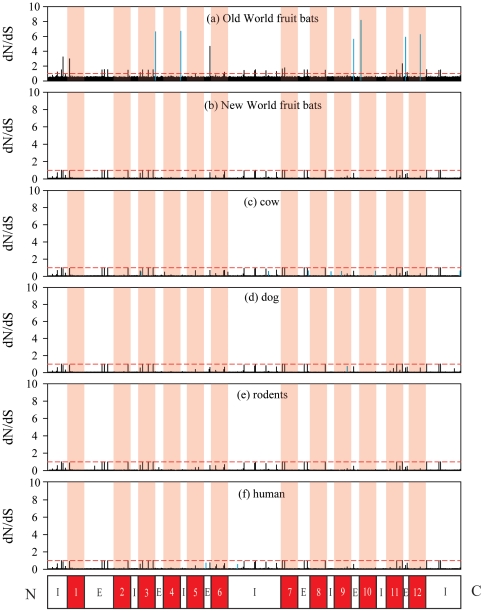
Figure 3. Omega (dN/dS) values for sites along the Slc2a4 sequence of selected branches.
(a) Old World fruit bats, (b) New World fruit bats, (c) cow, (d) dog, (e) rodents and (f) human. The omega value of 1 is indicated by red dash line in each plot. Domains of the GLUT4 protein [4] are shown under the plot: 12 transmembrane domains are colored with red and pink, “I” indicates intracellular domain, “E” indicates extracellular domain. Amino acid sites having BEB posterior probability (>0.5) of being under positive selection are shown in blue.

