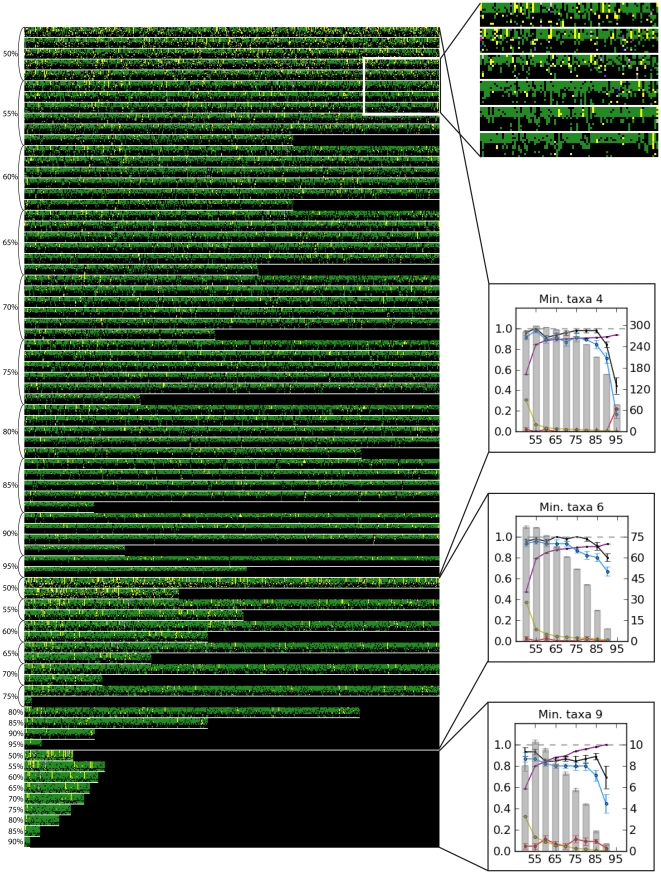
Figure 2. The orthology of one replicate of the 100 bp SbfI Drosophila matrices based on the concatenated alignment (701-299,470 bp) of all 12 genomes after restriction cutting and clustering without prior knowledge of orthology.
Each column of square pixels bounded by white lines represents a single cluster (locus) produced by a given set of parameters. Each row within these clusters represents a single taxon. Therefore, between each pair of horizontal white lines is a grid where rows are taxa and columns are clusters. The order of taxa from top to bottom of each cluster is: D. simulans, D. sechellia, D. melanogaster, D. yakuba, D. erecta, D. ananassae, D. pseudoobscura, D. persimilis, D. willistoni, D. virilis, D. mojavensis, and D. grimshawi. The area in the white box is blown up in the inset to show detail. Within a cluster, black indicates that a taxon did not have a sequence in that cluster. Colors in a cluster represent orthologous sequences. For example, the top right cluster (or last column in the top row) in the expanded portion contains orthologous sequences from D. simulans and D. sechellia (yellow), and orthologous sequences from D. melanogaster, D. yakuba, and D. erecta (green), though sequences from the two groups are not orthologous. The cluster immediately to the left contains orthologous sequences from D.pseudoobscura, D. persimilis, D. mojavensis, and D. grimshawi. The values of similarity used for clustering the sequences in each matrix are indicated on the left and the minimum threshold number of taxa (min. taxa) is indicated by the plots on the right. These plots are exactly as in Fig. 3. Note that many parameter combinations yield matrices that span several lines. The boundaries between matrix representations are indicated on the left.

