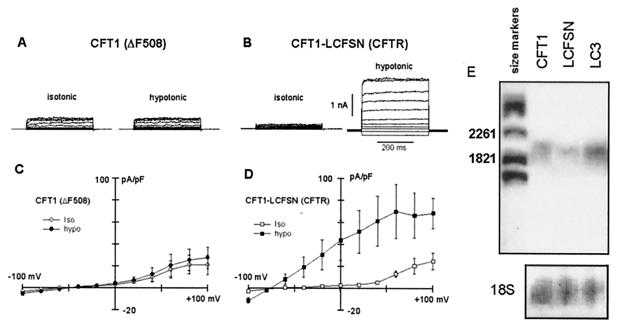
Figure 3.
Response of hIK channels to cell swelling in CFT1 and CFT1-LCFSN cells. Potassium currents were measured in both CFT1 cells (A) and CFT1-LCFSN cells (B) under isotonic and hypotonic solutions (3 min). (C and D) Current/voltage relationships obtained under isotonic conditions for CFT1 cells (○; n = 7) and CFT1-LCFSN cells (□; n = 7) and 3 min after exposure of CFT1 cells (●; n = 7) and CFT1-LCFSN cells (■; n = 7) to hypotonic solutions. (E) Northern blot analysis of hIK expression in CFT1, CFT1-LC3, and CFT1-LCFSN cells. Left lane shows the size markers. (Bottom) Ribosomic RNA shown as control for the amount of RNA in each lane.

