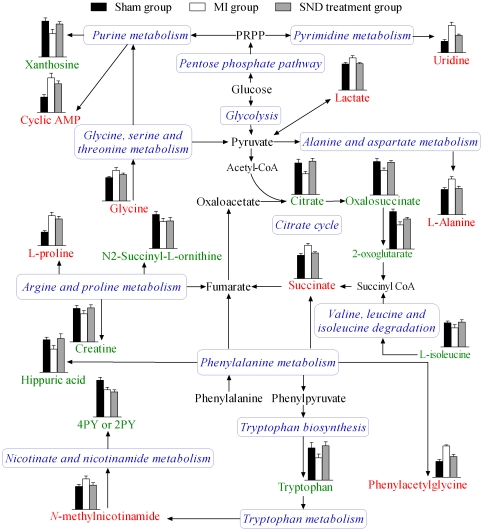
Figure 9. The network of the potential biomarkers changing for MI and SND modulation according to the KEGG PATHWAY database.
Column value in histograms is expressed as mean ± S.D., in which the value of citrate, creatine, tryptophan and hippuric acid derived from UHPLC-MS and those of the other metabolites derived from respective analysis system (UHPLC-MS or 1H NMR). Metabolite names in red and green represent elevation and inhibition, respectively. Metabolite names in black mean they were not detected in our experiment. The blue italic words are pathway's names. PRPP, phosphoribosyl pyrophosphate.

