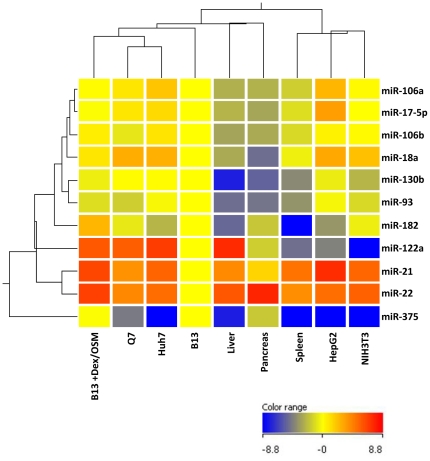
Figure 2. The miRNA expression profile of transdifferentiated AR42J-B13 cells is most closely related to those of hepatoma cell lines by clustering analysis.
The expression levels of miRNAs of various hepatoma cell lines (HepG2, Huh7 and Q7 cells), primary tissues (rat spleen, pancreas and liver), and NIH3T3 cells, were measured by stem-loop real-time PCR analysis. Clustering analysis using Genespring V11.0 software was performed by the normalization of the expression level from each sample relative to that of AR42J-B13 cells. Both up-regulated miRNAs (miR-21, miR-22, miR-122a and miR-182) and down-regulated miRNAs (miR-17-5p, miR-18a, miR-93, miR-106a, miR-106b, miR-130b and miR-375) were chosen as a parameter for comparison.

