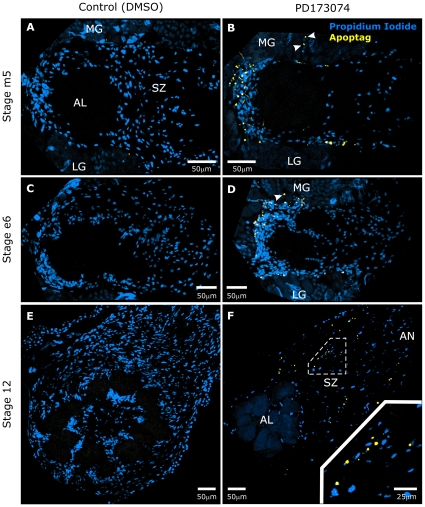
Figure 10. Blocking glial FGFR activation leads to apoptosis.
A–F: Control and PD173074-treated animals were allowed to develop to various stages, then dissected and analyzed for apoptotic nuclei using the TUNEL technique. Numerous apoptotic nuclei (yellow) were seen in treated animals (panels B,D,F), but few to no apoptotic nuclei were seen in control animals (panels A,C,E) at all stages examined. Propidium iodide (blue) was used to visualize all cell nuclei. Arrowheads in panels B,D indicate apoptotic nuclei among the medial group of antennal lobe neurons. Inset in panel F shows a higher magnification view of a region within the sorting zone of the antennal nerve. Projection depths = 10 µm.

