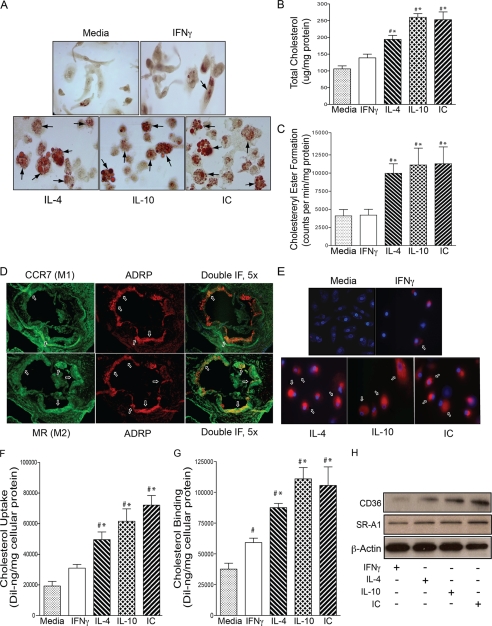
FIGURE 1.
M2 macrophage differentiation induces foam cell formation. For A–C and E–H, macrophages from diabetic patients were differentiated with IFNγ to promote M1 differentiation or with IL-4, IL-10, or IC to promote M2 differentiation and then stimulated with oxLDL. A, staining with Oil Red O. Top panel, media, IFNγ-treated cells; Bottom panel, IL-4, IL-10, and IC-treated cells. Arrowheads indicate foam cells. Shown are total cholesterol (B) and cholesteryl ester (C) formation in macrophages incubated with media (gray), IFNγ (white), IL-4 (back-slashed), IL-10 (hatched), and IC (front-slashed) (n = 8 per group). *, p < 0.0001 versus media; #, p < 0.001 versus IFNγ by ANOVA. D, immunofluorescent staining of antibodies to M1 or M2 macrophages in the aortic sinus atherosclerotic lesions from ApoE−/− mice after 8 weeks on Western diet (n = 5 per group). Top panel, arrows indicate stain for M1 marker CCR7 (green), ARDP (red), and co-staining for ARDP and CCR7 (yellow). Bottom panel, arrows indicate stain for M2 marker MR (green), ARDP (red), and costaining for ARDP and MR (yellow). Scale bars, 100 μm. E, macrophage cholesterol uptake assessed by confocal microscopy. Red represents labeled cholesterol uptake after 6 h of stimulation with 1,1′-dioctadecyl-3,3, 3′3′-tetramethylindocarbocyanine perchlorate oxLDL; blue represents nuclear counterstain. Shown are quantification of macrophage cholesterol uptake (F) and cholesterol binding (G) by mean fluorescence absorbance after DiI-oxLDL stimulation (n = 8 per group). *, p < 0.0001 versus media; #, p < 0.01 versus IFNγ by ANOVA for both. H, Western blot for CD36 and SR-A1 expression. IF, immunofluorescence.

