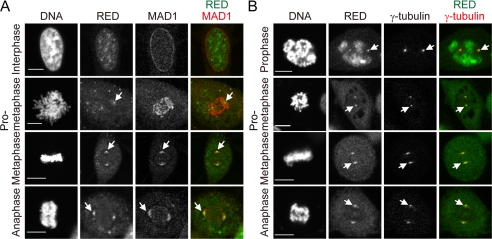
FIGURE 4.
Intracellular localization of RED. A, colocalization of MAD1 and RED at the spindle poles in metaphase and anaphase. Cells were fixed with paraformaldehyde and simultaneously stained with rat anti-MAD1 and rabbit anti-RED antibodies, followed by Cy3-conjugated anti-rat IgG and FITC-conjugated anti-rabbit IgG antibodies. Chromosomal DNA was stained with DAPI. Stained cells were visualized by confocal laser microscope. The arrows indicate the locations of the spindle poles. Scale bar = 10 μm. B, localization of RED at the spindle poles. Cells were fixed with cold methanol and simultaneously stained with rabbit anti-RED and mouse anti-γ-tubulin antibodies, followed by FITC-conjugated anti-rabbit IgG and Cy3-conjugated anti-mouse IgG antibodies. Arrows indicate the locations of the spindle poles. Scale bar = 10 μm.

