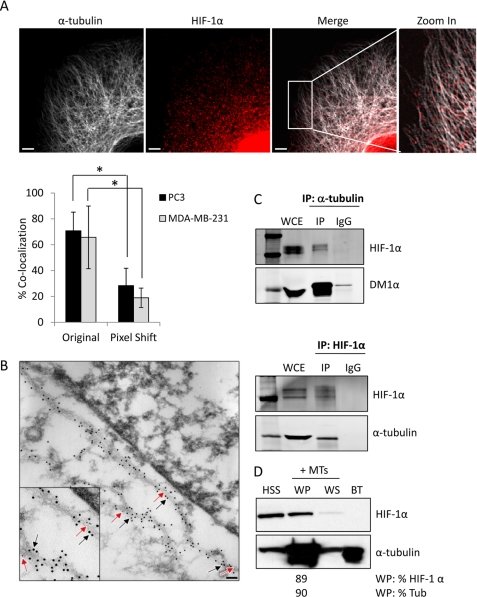
FIGURE 2.
HIF-1α protein associates with microtubules. A, confocal microscopy images of PC3 cells subjected to hypoxia for 6 h and labeled with anti-HIF-1α (red) and anti-α-tubulin (white) antibodies. Right panel shows a higher magnification of the marked cytoplasmic area. Scale bars: 2 μm. The bar graph represents percent co-localization between α-tubulin and HIF-1α protein in PC3 or MDA-MB-231 cells in original and pixel-shifted images (mean ± S.D. *, p < 0.05, t test). B, representative immuno-TEM image of PC3 cells fixed and processed for colloidal gold immunolabeling using primary antibodies against HIF-1α (6 nm colloidal gold secondary antibody, red arrows) or α-tubulin (12 nm colloidal gold secondary antibody, black arrows), following 6 h hypoxia. Inset: higher magnification showing co-localization between HIF-1α protein and microtubules. Scale bar: 0.2 μm. C. PC3 cells were exposed to 4 h hypoxia, lysed, and subjected to immunoprecipitation using a rat anti-α-tubulin antibody or matching rat IgG. Immunoprecipitates and 50 μg of whole cell extract (WCE) were resolved by SDS-PAGE and immunoblotted with antibodies against HIF-1α or mouse α-tubulin (DM1α) (top panel). MCF7 cells exposed to hypoxia for 4 h and subjected to immunoprecipitation using an antibody against HIF-1α and immunoblotted with antibodies against HIF-1α or rat α-tubulin (YL1/2 antibody) (bottom panel). D, microtubule co-sedimentation assay of PC3 cells lysates exposed to a 6 h hypoxia and incubated with exogenous purified bovine brain tubulin (BT) for 30 min at 37 °C in the presence of Taxol. Briefly, the pre-cleared high speed supernatant (HSS) was used as input for the assay and was subjected to a 100,000 × g centrifugation at 37 °C to separate the microtubule polymers (warm pellet, WP) from the soluble tubulin dimers (warm supernatant, WS). All fractions were resolved by SDS-PAGE and immunoblotted for the presence of HIF-1α and tubulin. The distribution of HIF-1α in each fraction was assessed by densitometry.

