FIGURE 2.
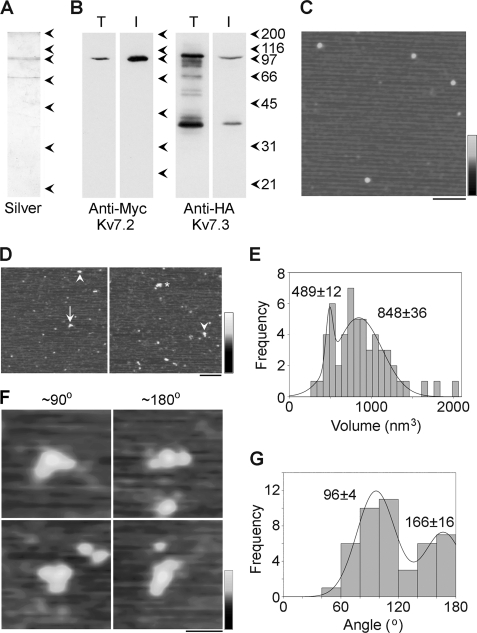
Decoration of Myc-Kv7.2/2xHA-Kv7.3 channels with anti-Myc antibodies. A and B, samples of total cell extract (T) and protein isolated by affinity chromatography (I) were analyzed by SDS-polyacrylamide gel electrophoresis followed by either silver staining (A) or immunoblotting (B) using mouse monoclonal anti-Myc (Kv7.2, left panel) or anti-HA (Kv7.3, right panel) antibodies. Immunoreactive bands were visualized using a horseradish peroxidase-conjugated goat anti-mouse secondary antibody followed by enhanced chemiluminescence. The arrowheads indicate molecular mass markers (kDa). C, low-magnification AFM image of a sample of isolated Kv7.2/Kv7.3. Scale bar = 200 nm; shade-height scale = 0–4 nm. D, low-magnification AFM images of a sample of Kv7.2/Kv7.3 that had been incubated with anti-Myc antibodies. The arrowheads indicate singly decorated particles, the arrow indicates a doubly decorated particle, and the asterisk indicates a triply decorated particle. Scale bar = 200 nm, shade-height scale = 0–4 nm. E, frequency distribution of particles that were multiply decorated by anti-Myc antibodies. The curve indicates the fitted Gaussian functions. The peaks of the distributions are indicated. F, gallery of zoomed images of Kv7.2/Kv7.3 particles that are decorated by two antibodies at angles of around 90° (left panels) and 180° (right panels). Scale bar = 50 nm, shade-height scale = 0–3 nm. G, frequency distribution of angles between pairs of bound antibodies. The curve indicates the fitted Gaussian functions. The peaks of the distribution are indicated.

